A timeline and “family tree” of the major American movie studios. Organized around the top 5 producers of feature films throughout the years. The “market share” percentages on the right edge of the graphic are sourced from The-Numbers.com 2020 Distributors Gross Earnings. The information is based on the “major film studios” chart on Wikipedia.
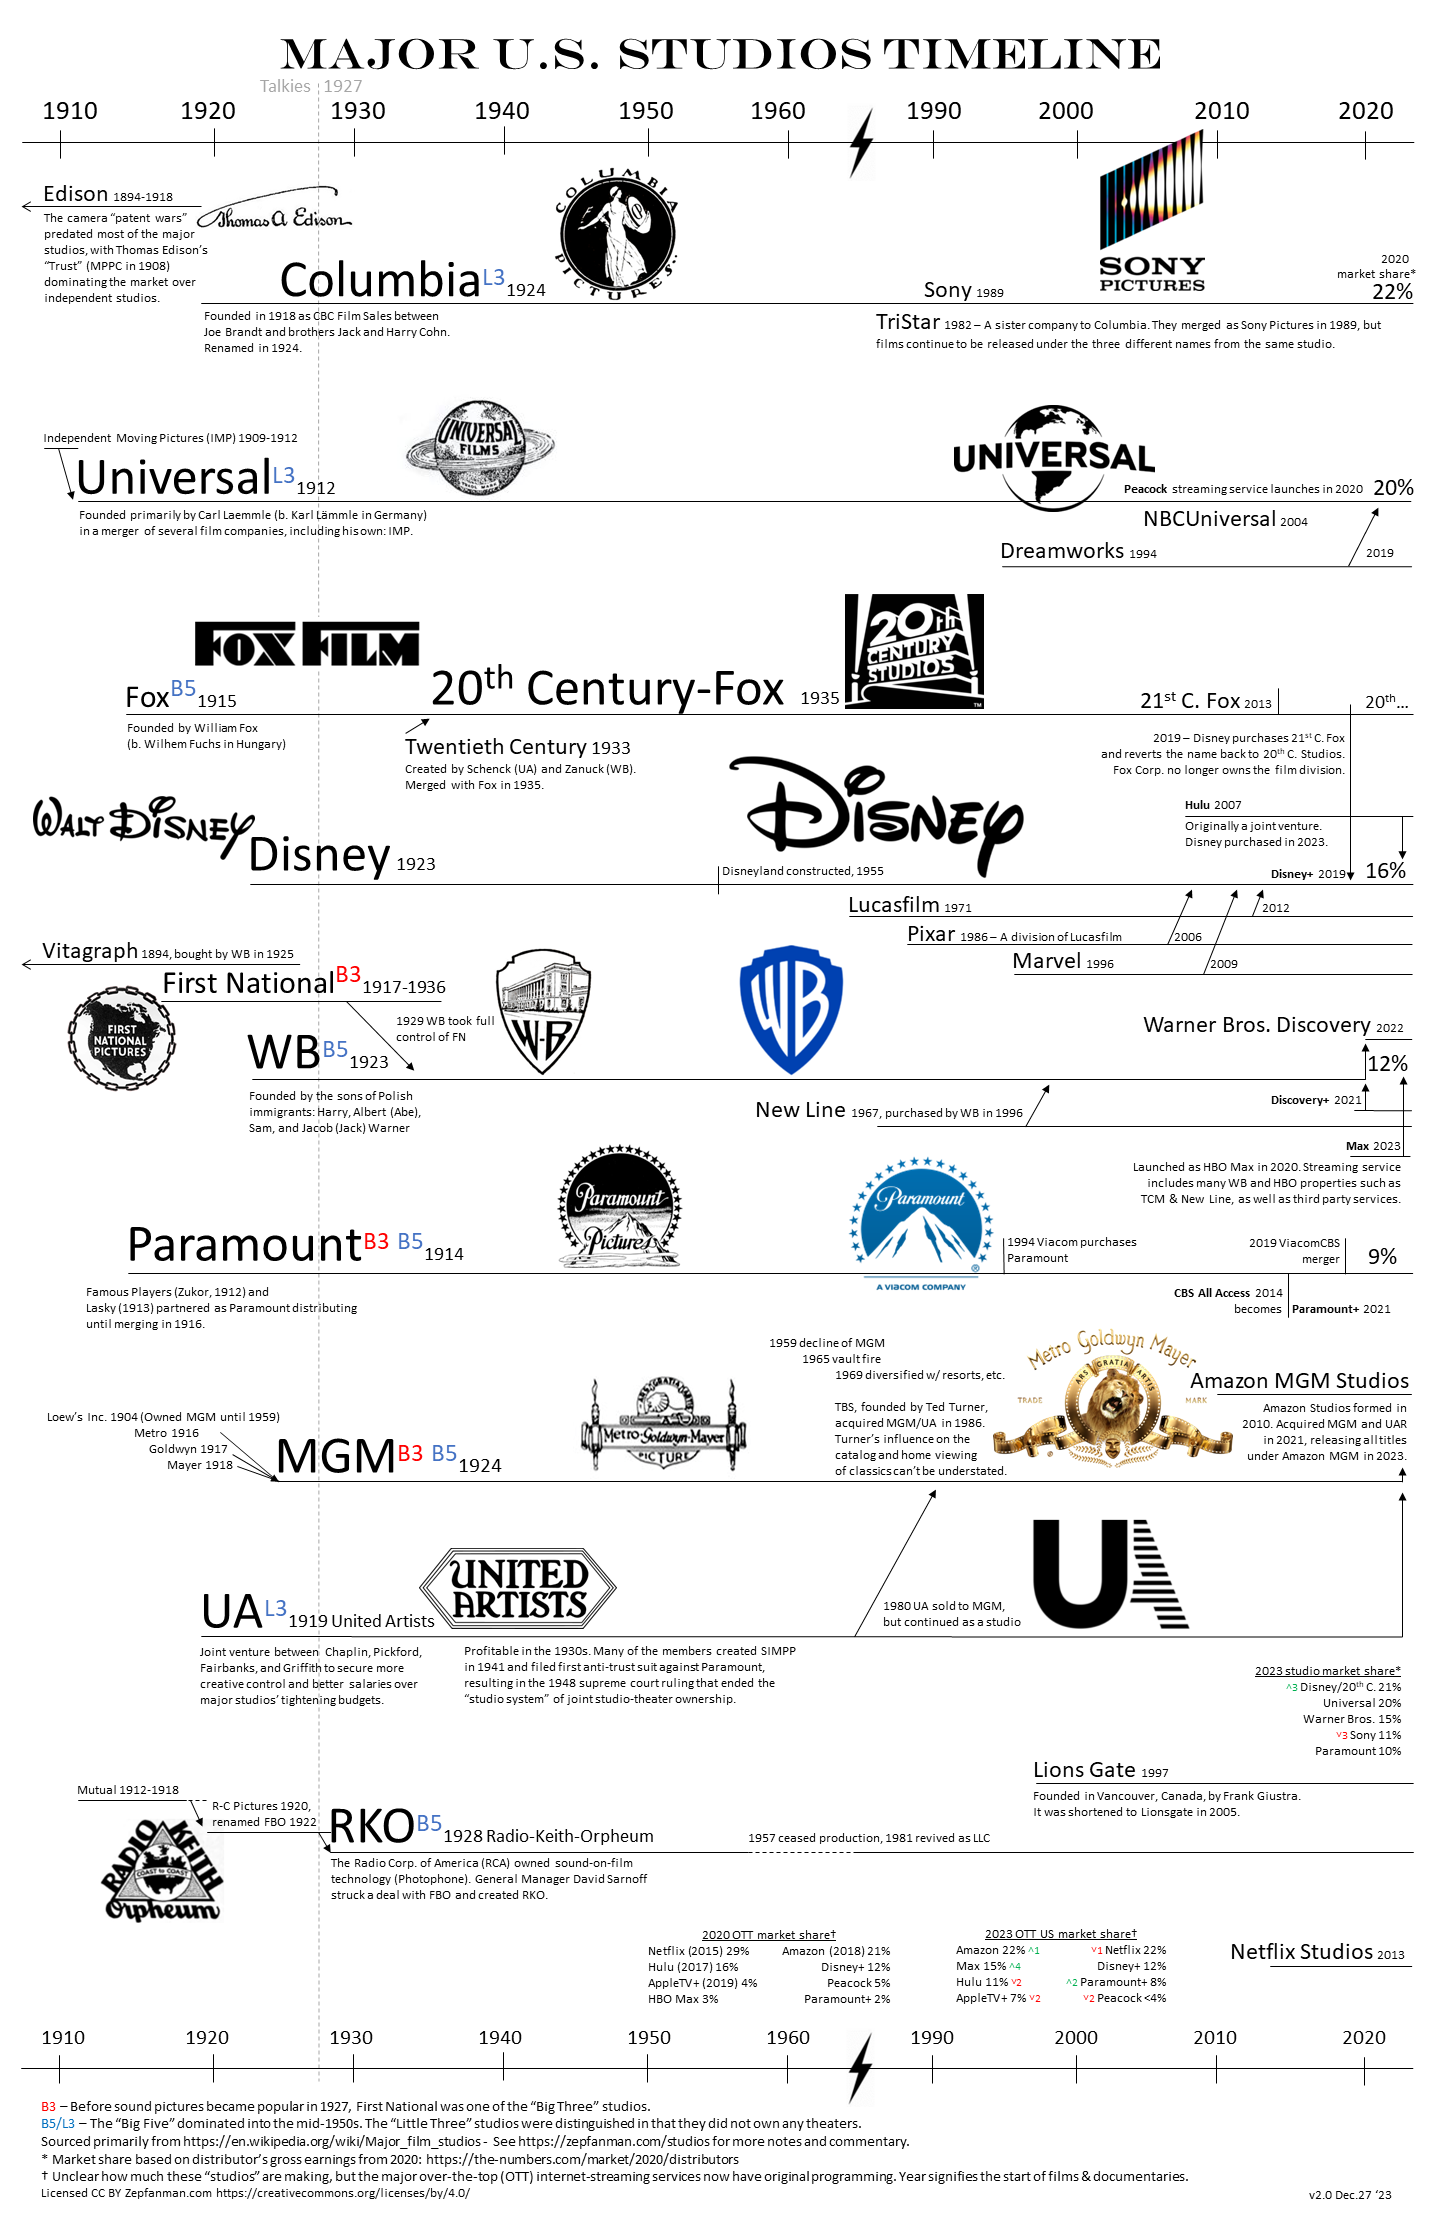
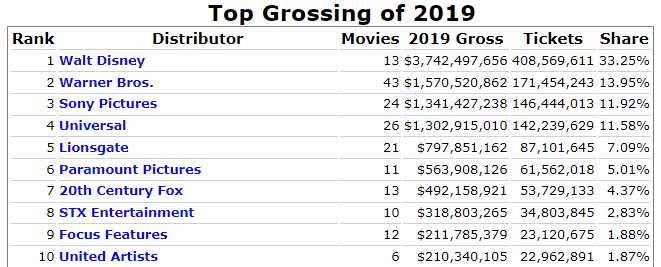
Below are screenshots from The-Numbers.com comparing the 2019 and 2021 (as of December 11th) top-earners. Sony (Columbia), Universal, Warner Bros., Disney, United Artists, and Paramount have generally done very well, and Lionsgate has been in the top 7 for the past 10 years. 20th Century Fox is essentially 20th Century Pictures now. MGM is limited to 1 or 2 releases a year, and RKO is just a shell of what it was before the 1950s.

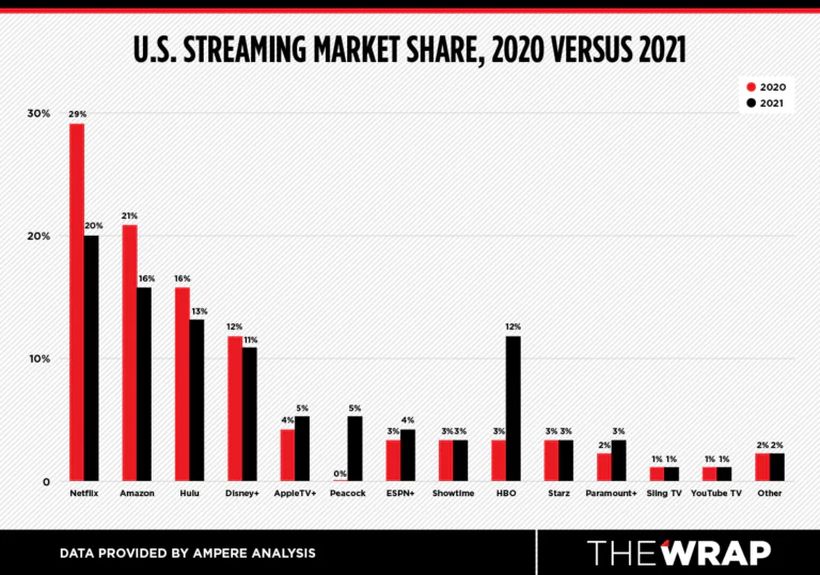
Over-the-top (OTT) streaming services like Netflix and AppleTV+ have started making original feature films and documentaries in the past few years. Hulu is owned by two of the largest studios, Disney (67%) and NBCUniversal (33%), boosting its OTT market share. The graphic below show’s the huge jump in HBO’s market share this year, likely because of its partnership with WB (who decided to release every 2021 film on HBO on the same day of its theatrical release).
In the future, I may do some more research on the top films throughout the years from each major studio. Prior to Box Office Mojo changing their website in 2019, they had an All Time Box Office list of 300 films, with the studios listed. It’s now only available via Archive.org.
On a personal note, as I’ve worked through the decades in my 10 Years 10 Films series, I’ve heard mention of the heads of certain studios and the styles of films that they produce, but it wasn’t something I focused on. I’ve looked around for a similar graphic to get more familiar with the major Hollywood studios, but haven’t seen anything like what I’ve produced here. As always, feedback is welcomed, and feel free to copy it according to the CC license. I’m no graphical artist, so I’d be thrilled to see a better design. Please let me know if you’ve modified it.
Download the high-quality PDF here.
Changelog:
1.0 12/12: Original publication: PNG | PDF
1.1 12/12: Stretched page size from letter to legal/tabloid dimensions (11×17). Added Hulu and AppleTV+ in a streaming market share section, with notes & TheWrap graphic added in the text above. Added small paragraph to the infographic about Ted Turner.
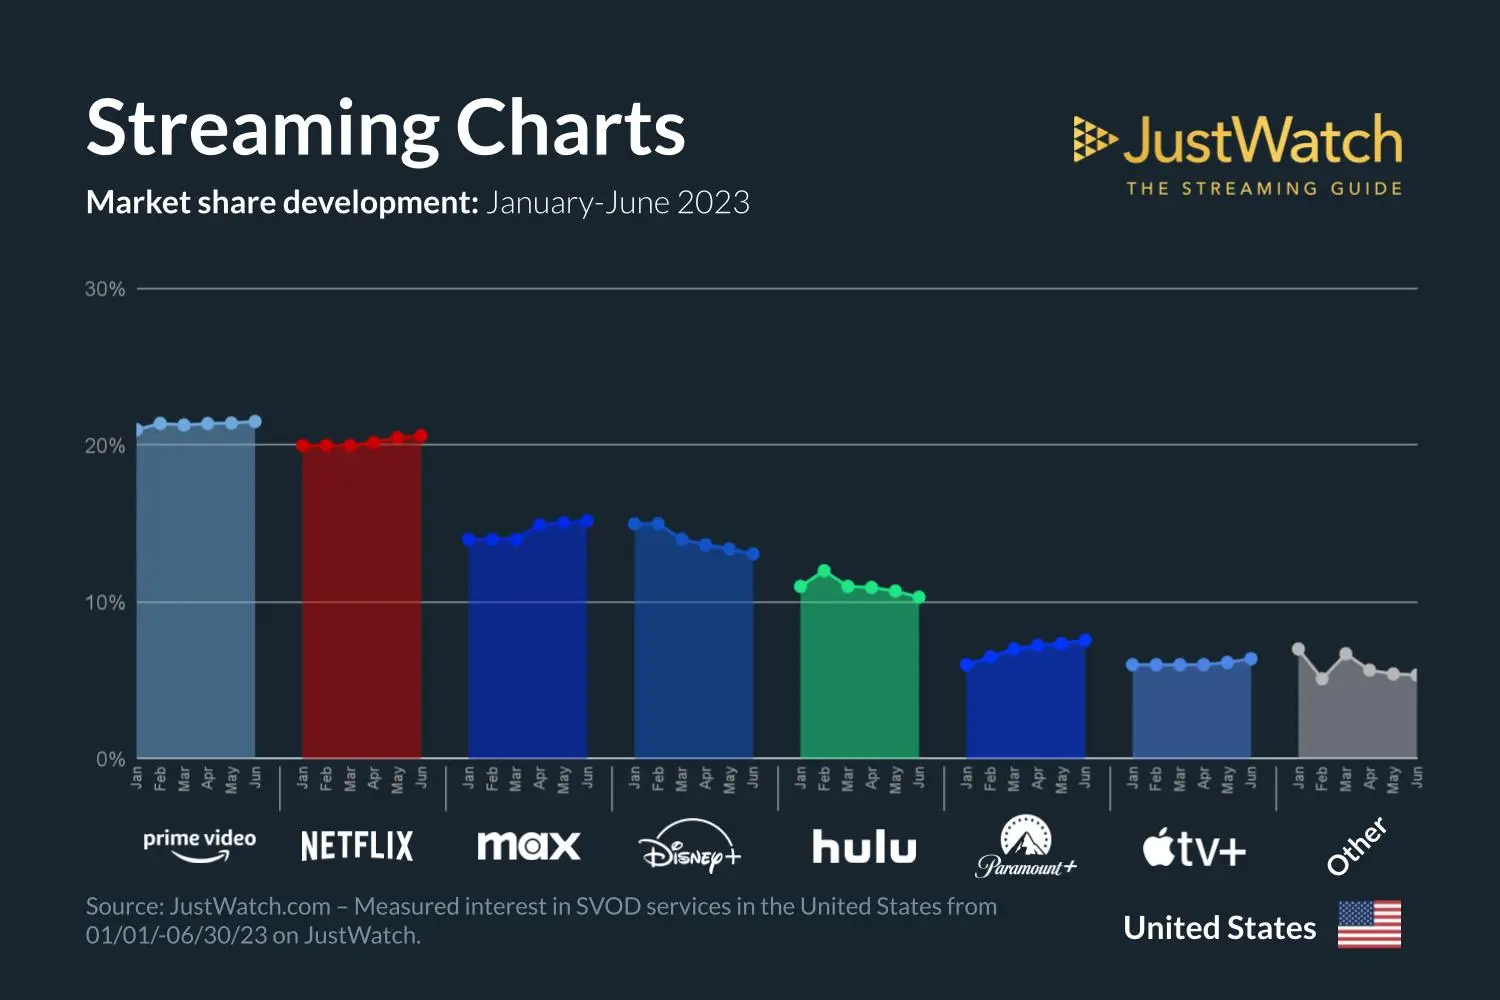
1.2 7/9/23: Fixed minor typo on the chart in RKO description. Replace erroneous original UA logo. Added 2023 graphic to this post. Compared to 2021: Amazon, Max (HBO), and Paramount have increased the most; Hulu has dropped the most.
2.0 12/27/23: Updated studio mergers for 2023. Disney and Sony essentially swapped their market shares since 2020.